
If you like your motorsport, you’ll know that you’ve been pretty spoilt for choice for the last few months. Whether it’s four wheels or two wheels that you love watching the most, the end of 2015 and all of 2016 to date has seen the TV schedules packed with MotoGP, Superbikes, Formula One and Formula-E. And all of them have been busy – and probably successfully – battling it out for your affections and attention over intermittent weekends.
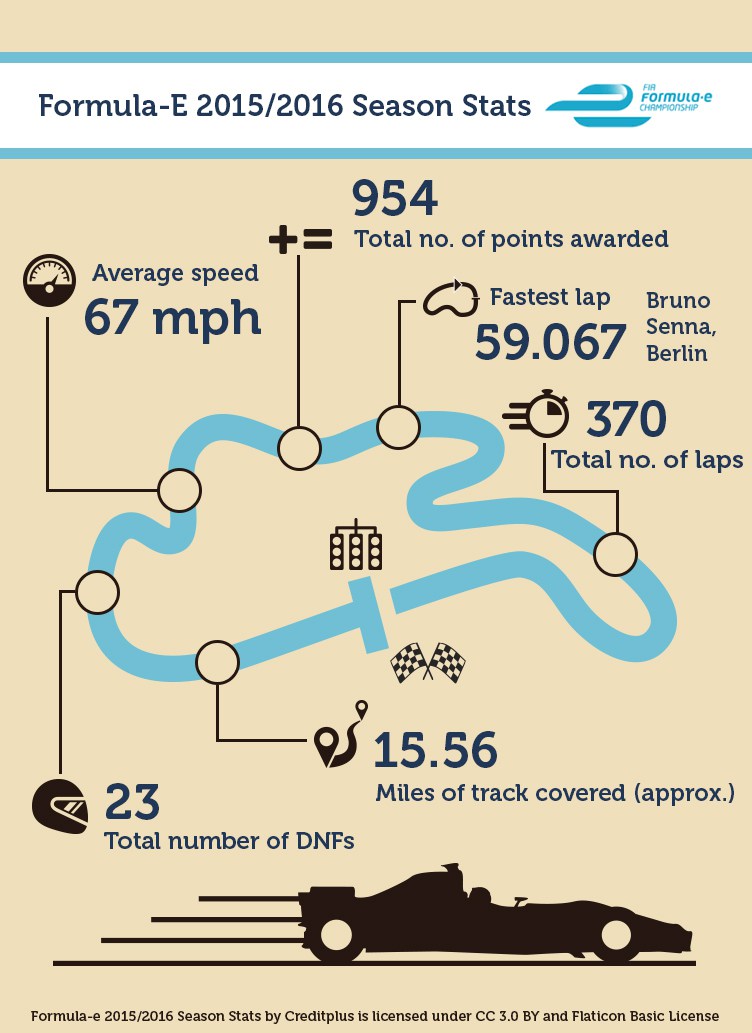
With Formula-E being the newest motorsport kid on the block, we’ve been keeping an eagle eye on the 2015/2016 season since it kicked off in October last year. Over the following 9 months – where 10 races have been held – a lot of interesting statistics have been collected. And seeing as the Creditplus Blogging team are pretty big motorsport fans, we’ve put together the below infographic that details just some of the racing class’s most important pieces of data from across the season. So if you like your stats, this infographic is one for you.

 Facebook
 Twitter
 Instagram
 LinkedIn
 Youtube